Global Azure Bootcamp: Car Lab Analysis

As part of the Global Azure Bootcamp, the organizers created a hand-on lab where individuals could install a racing game and compete against other drivers.  The cool thing was the amount of telemetry that the game pushed to Azure (I assume using Event Hubs to Azure Tables).  The lab also had a basic “hello world” web app that could read data from the Azure Table REST endpoints so newcomers could see how easy it was to create and then deploy a website on Azure.

I decided to take a bit of a jaunt though the data endpoint to see what analytics I could run on it using Azure ML.  I went to the initial endpoint here and sure enough, the data comes down in the browser.  Unfortunately, when I set it up in Azure ML using a data reader:

image

I got 0 records returned.  I think this has something to do with how the datareader deals with XML.  I quickly used F# in Visual Studio with the XML type provider:

1 #r "../packages/FSharp.Data.2.2.0/lib/net40/FSharp.Data.dll" 2 3 open FSharp.Data 4 5 [<Literal>] 6 let uri = "https://reddoggabtest-secondary.table.core.windows.net/TestTelemetryData0?tn=TestTelemetryData0&sv=2014-02-14&si=GabLab&sig=GGc%2BHEa9wJYDoOGNE3BhaAeduVOA4MH8Pgss5kWEIW4%3D" 7 8 type CarTelemetry = XmlProvider<uri> 9 let carTelemetry = CarTelemetry.Load(uri) 10 11

I reached out to the creator of the lab and he put a summary file on Azure Blob Storage that was very easy to consume with AzureML, you can find it herehere.  I created Regression to predict the amount of damage a car will sustain based on the country and car type:

image

This was great, but I wanted to working on my R chops some so I decided to play around with the data in R Studio.  I imported the data into R Studio and then fired up the scripting window.  The first question I wanted to answer was “how does each country stack up against each other in terms of car crashes?”

I did some basic data exploration like so:

1 summary(PlayerLapTimes) 2 3 aggregate(Damage ~ Country, PlayerLapTimes, sum) 4 aggregate(Damage ~ Country, PlayerLapTimes, FUN=length) 5

image

And then getting down to the business of answering the question:

1 2 dfSum <- aggregate(Damage ~ Country, PlayerLapTimes, sum) 3 dfCount <- aggregate(Damage ~ Country, PlayerLapTimes, FUN=length) 4 5 dfDamage <- merge(x=dfSum, y=dfCount, by.x="Country", by.y="Country") 6 names(dfDamage)[2] <- "Sum" 7 names(dfDamage)[3] <- "Count" 8 dfDamage$Avg <- dfDamage$Sum/dfDamage$Count 9 dfDamage2 <- dfDamage[order(dfDamage$Avg),] 10

image

So that is kinda interesting that France has the most damage per race.  I have to ask Mathias Brandewinder about that.

In any event, I then wanted to ask “what county finished first”.  I decided to apply some R charting to the same biolerplate that I created earlier

1 dfSum <- aggregate(LapTimeMs ~ Country, PlayerLapTimes, sum) 2 dfCount <- aggregate(LapTimeMs ~ Country, PlayerLapTimes, FUN=length) 3 dfSpeed <- merge(x=dfSum, y=dfCount, by.x="Country", by.y="Country") 4 names(dfSpeed)[2] <- "Sum" 5 names(dfSpeed)[3] <- "Count" 6 dfSpeed$Avg <- dfSpeed$Sum/dfSpeed$Count 7 dfSpeed2 <- dfSpeed[order(dfSpeed$Avg),] 8 plot(PlayerLapTimes$Country,PlayerLapTimes$Damage) 9

image


image

So even though France appears to have the slowest drivers, the average is skewed by 2 pretty bad races –> perhaps the person never finished.

In any event, this was a fun exercise and I hope to continue with the data to show the awesomeness of Azure, F#, and R…


Battlehack Raleigh

This last weekend, I was fortunate enough to be part of a team that competed in Battlehack, a world-wide hackathon sponsored by Paypal.  The premise of the hackathon is that you are coding an application that uses Paypal and is for social good. 

My team met one week before and decided that the social problem that the application should address is how to make teenage driving safer.  This topic was inspired by this heat map that shows that there is a statistically significant increase of car crashes around certain local high schools.  The common theme of these high schools is that they are over capacity

HeatMapOfCaryCrashes

This is also a personal issue for my daughter, whose was friendly with a girl who died in an accident last year near Panther Creek High School.  In fact, she still wears a bracelet with the victims name on it.  Unfortunately, she could not come b/c of school and sports commitments that weekend.

The team approached safe driving as a “carrot/stick” issue with kids.  The phone app will capture the speed at which they are driving.  If they stay within a safe range for the week, they will receive a cash payment.  If they engage in risky behavior (speeding, fast stops, etc..), they will have some money charged to them.  We used the hackathon’s sponsors Braintree’s for payment and SendGrid for email.

We divided the application into a couple major sections and the division of labor along each component.  I really wanted to use Azure EventHubs and Stream Analytics but the Api developer was not familiar with that and a hackathon is defiantly not a place where you want to learn a new technology.


image

We set to work

image

Here is the part of the solution that I worked on:

image

The Api is a typical boiler plate MVC5/Web Api2 application and the Data Model holds all of the server data structures and Interfaces.  C# was the right choice there as the Api developer was a C# web dev and the C# data structures serialize nicely to Json.

I did all of the Poc in the F# REPL and then moved the code into a compliable assembly.  The Braintree code was easy with their Nuget package:

1 type BrainTreeDebitService() = 2 interface IDebitService with 3 member this.DebitAccount(customerId, token, amount) = 4 let gateway = new BraintreeGateway() 5 gateway.Environment <- Environment.SANDBOX 6 gateway.MerchantId <- "aaaa" 7 gateway.PublicKey <- "bbbbb" 8 gateway.PrivateKey <- "cccc" 9 10 let transaction = new TransactionRequest() 11 transaction.Amount <- amount 12 transaction.CustomerId <- customerId 13 transaction.PaymentMethodToken <- token 14 gateway.Transaction.Sale(transaction) |> ignore

The Google Maps Api does have a nice set of methods for calculating Speed Limit.  Since I didn’t have the right account, I only had some demo Json –> enter the F# Type Provider:

1 type SpeedLimit = JsonProvider<"../Data/GoogleSpeedLimit.json"> 2 3 type GoogleMapsSpeedLimitProvider() = 4 interface ISpeedLimitProvider with 5 member this.GetSpeedLimit(latitude, longitude) = 6 let speedLimits = SpeedLimit.Load("../Data/GoogleSpeedLimit.json"); 7 let lastSpeedLimit = speedLimits.SpeedLimits |> Seq.head 8 lastSpeedLimit.SpeedLimit

Finally, we used MongoDb for our data store:

1 2 type MongoDataProvider() = 3 member this.GetLatestDriverData(driverId) = 4 let connectionString = "aaa" 5 let client = MongoDB.Driver.MongoClient(connectionString) 6 let server = client.GetServer() 7 let database = server.GetDatabase("battlehackraleigh"); 8 let collection = database.GetCollection<DriverPosition>("driverpositions"); 9 let collection' = collection.AsQueryable() 10 let records = collection'.Where(fun x -> x.DriverId = driverId) 11 records |> Seq.head 12 13 member this.GetCustomerData(customerId)= 14 let connectionString = "aaa" 15 let client = MongoDB.Driver.MongoClient(connectionString) 16 let server = client.GetServer() 17 let database = server.GetDatabase("battlehackraleigh"); 18 let collection = database.GetCollection<Customer>("customers"); 19 let collection' = collection.AsQueryable() 20 let records = collection'.Where(fun x -> x.Id = customerId) 21 records |> Seq.head 22 23 member this.GetCustomerDataFromDriverId(driverId)= 24 let connectionString = "aaa" 25 let client = MongoDB.Driver.MongoClient(connectionString) 26 let server = client.GetServer() 27 let database = server.GetDatabase("battlehackraleigh"); 28 let collection = database.GetCollection<Customer>("customers"); 29 let collection' = collection.AsQueryable() 30 let records = collection'.Where(fun x -> x.Number = driverId) 31 records |> Seq.head

There were 19 teams in Raleigh’s hackathon and my team placed 3rd.  I think the general consensus of our team (and the teams around us) is that we should have won with the idea but our presentation was very weak (the problem with coders presenting to non-coders).  We had 2 minutes to present and 1 minute for QA.  We packed our 2 minutes with technical details when we should have been spinning the ideas.  Also, I completely blew the QA piece. 

Question #1

Q: “How did you Integration IBM Watson?”

A: “We used it for the language translation service”

A I Wished I Said: “We baked machine learning into the app.  Do you know how Uber does surge pricing?  We tried a series of models that forecast a person’s driving based on their recent history.  If we see someone creeping up the danger scale, we increase the reward payout for them for the week.  The winning model was a linear regression, it had the best false-positive rate.  It is machine learning because we continually train our model as new data comes in.

Question #2

Q: “How will you make money on this?”

A: “Since we are taking money from poor drivers and giving it to good drivers, presumably we could keep a part for the company”

A I Wished I Said: “Making is money is so far from our minds.  Right now, there are too many kids driving around over capacity schools and after talking to the chief of police, they are looking for some good ideas.  This application is about social good first and foremost.”

Lesson learned –> I hate to say it, but if you are in a hack-a-thon, you need to know the judge’s background.  There was not an obvious coder on the panel, so we should have gone with more high level stuff and answered technical details in the QA.  Unfortunately, the coaches at Battlehack said it was the other way around (technical details 1st) in our dry-run.  In fact, we ditched the slide that showed a picture of the car crash at Panther Creek High School that started this app as well as the heat map.  That would have been much more effective in hindsight.

Refactoring McCaffrey’s Regression to F#

James McCaffrey’s most recent MSDN article is about multi-class regression article is a great starting place for folks interested in the ins and outs of creating a regression.  You can find the article here.  He wrote the code in C# in a very much imperative style so the FSharp in me immediately wanted to rewrite it in F#.

Interestingly, Mathias Brandewinder also had the same idea and did a better (and more complete) job than me.  You can see his post here.

I decided to duck into McCaffrey’s code and see where I could rewrite part of the code.  My first step was to move his C# code to a more manageable format.

image

I changed the project from a console app to a .dll and then split the two classes into their own file.  I then added some unit tests so that I can verify that my reworking was correct:

1 [TestClass] 2 public class CSLogisticMultiTests 3 { 4 LogisticMulti _lc = null; 5 double[][] _trainData; 6 double[][] _testData; 7 8 public CSLogisticMultiTests() 9 { 10 int numFeatures = 4; 11 int numClasses = 3; 12 int numRows = 1000; 13 int seed = 42; 14 var data = LogisticMultiProgram.MakeDummyData(numFeatures, numClasses, numRows, seed); 15 LogisticMultiProgram.SplitTrainTest(data, 0.80, 7, out _trainData, out _testData); 16 _lc = new LogisticMulti(numFeatures, numClasses); 17 18 int maxEpochs = 100; 19 double learnRate = 0.01; 20 double decay = 0.10; 21 _lc.Train(_trainData, maxEpochs, learnRate, decay); 22 } 23 24 [TestMethod] 25 public void GetWeights_ReturnExpected() 26 { 27 double[][] bestWts = _lc.GetWeights(); 28 var expected = 13.939104508387803; 29 var actual = bestWts[0][0]; 30 Assert.AreEqual(expected, actual); 31 } 32 33 [TestMethod] 34 public void GetBiases_ReturnExpected() 35 { 36 double[] bestBiases = _lc.GetBiases(); 37 var expected = 11.795019237894717; 38 var actual = bestBiases[0]; 39 Assert.AreEqual(expected, actual); 40 } 41 42 [TestMethod] 43 public void GetTrainAccuracy_ReturnExpected() 44 { 45 var expected = 0.92125; 46 var actual = _lc.Accuracy(_trainData); 47 Assert.AreEqual(expected, actual); 48 } 49 50 [TestMethod] 51 public void GetTestAccuracy_ReturnExpected() 52 { 53 var expected = 0.895; 54 double actual = _lc.Accuracy(_testData); 55 Assert.AreEqual(expected, actual); 56 } 57 } 58

You will notice that this is the exact code that McCaffrey uses in his output for the Console app.  In any event, they were running all green

image

I then went into the F# Project and fired up the REPL.  I decided to start with the MakeDummyData method because it seemed beefy enough to demonstrate the language differences between the languages, it is fairly self-contained, and its data is already testable.  Here is the first 9 lines of code.

1 Random rnd = new Random(seed); 2 double[][] wts = new double[numFeatures][]; 3 for (int i = 0; i < numFeatures; ++i) 4 wts[i] = new double[numClasses]; 5 double hi = 10.0; 6 double lo = -10.0; 7 for (int i = 0; i < numFeatures; ++i) 8 for (int j = 0; j < numClasses; ++j) 9 wts[i][j] = (hi - lo) * rnd.NextDouble() + lo;

And here is the F# equivalent

1 let rnd = new Random(seed) 2 let hi = 10.0 3 let lo = -10.0 4 let wts = Array.create numFeatures (Array.create numClasses 1.) 5 let wts' = wts |> Array.map(fun row -> row |> Array.map(fun col -> (hi - lo) * rnd.NextDouble() + lo)) 6

There is one obvious difference and 1 subtle difference.  The obvious difference is that the F# code does not do any looping to create and populate the array of arrays data structure, rather it uses  the high-order Array.Map function.   This reduces the idiomatic line count from 9 to 5  – a 50% decrease (and a funny move from the 1980s).  (Note that I use the words “idiomatic line count” because you can reduce both examples to a single line of code but that makes in unworkable by humans.  Both examples show the typical way you would write code in the language.)  So with the fewer lines of code, which is more readable?  That is a subjective opinion.  A C#/Java/Javascript/Curly-Brace dev would say the C#.  Everyone else in the world would say F#.

The less obvious difference is that F# emphasizes immutability so that there are two variables (wts and wts’) and the C# has 1 variable that is mutated.  The implication is lost in such a small example, but if the numFeatures was large, you would want to take advantage of mutli-core processors and the F# code is ready for parallelism.  The C# code would have to be reworked to use an immutable collection.

The next lines create and populate the biases variable.  The C# Code:

1 double[] biases = new double[numClasses]; 2 for (int i = 0; i < numClasses; ++i) 3 biases[i] = (hi - lo) * rnd.NextDouble() + lo; 4

And the F# Code 

1 let biases = Array.create numClasses 1. 2 let biases' = biases |> Array.map(fun row -> (hi - lo) * rnd.NextDouble() + lo) 3

Same deal as before.  No loops or mutation.  Fewer lines of code and better readability.

The last set of code is a ball of string so it is very hard to separate out.


1 double[][] result = new double[numRows][]; // allocate result 2 for (int i = 0; i < numRows; ++i) 3 result[i] = new double[numFeatures + numClasses]; 4 5 for (int i = 0; i < numRows; ++i) // create one row at a time 6 { 7 double[] x = new double[numFeatures]; // generate random x-values 8 for (int j = 0; j < numFeatures; ++j) 9 x[j] = (hi - lo) * rnd.NextDouble() + lo; 10 11 double[] y = new double[numClasses]; // computed outputs storage 12 for (int j = 0; j < numClasses; ++j) // compute z-values 13 { 14 for (int f = 0; f < numFeatures; ++f) 15 y[j] += x[f] * wts[f][j]; 16 y[j] += biases[j]; 17 } 18 19 // determine loc. of max (no need for 1 / 1 + e^-z) 20 int maxIndex = 0; 21 double maxVal = y[0]; 22 for (int c = 0; c < numClasses; ++c) 23 { 24 if (y[c] > maxVal) 25 { 26 maxVal = y[c]; 27 maxIndex = c; 28 } 29 } 30 31 for (int c = 0; c < numClasses; ++c) // convert y to 0s or 1s 32 if (c == maxIndex) 33 y[c] = 1.0; 34 else 35 y[c] = 0.0; 36 37 int col = 0; // copy x and y into result 38 for (int f = 0; f < numFeatures; ++f) 39 result[i][col++] = x[f]; 40 for (int c = 0; c < numClasses; ++c) 41 result[i][col++] = y[c]; 42 } 43

Note the use of code comments, which is typically considered a code smell, even in demonstration code.

Here is the F# Code:

1 let x = Array.create numFeatures 1. 2 let x' = x |> Array.map(fun row -> (hi - lo) * rnd.NextDouble() + lo) 3 4 let xWts = Array.zip x' wts' 5 let xWts' = xWts |> Array.map(fun (x,wts) -> wts |> Array.sumBy(fun wt -> wt * x)) 6 7 let y = Array.create numClasses 1. 8 let yWts = Array.zip y xWts' 9 let y' = yWts |> Array.map(fun (y,xwt) -> y + xwt) 10 11 let yBias = Array.zip y' biases' 12 let y'' = yBias |> Array.map(fun (y,bias) -> y + bias) 13 14 let maxVal = y'' |> Array.max 15 16 let y''' = y'' |> Array.map(fun y -> if y = maxVal then 1. else 0.) 17 18 let xy = Array.append x' y''' 19 let result = Array.create numRows xy

This is pretty much the same as before,no loops, immutability, and a 50% reduction of code.  Also, notice that by using a more functional style breaks apart the ball of string.  Individual values are one their own line to be individual evaluated and manipulated.  Also, the if..then statement goes to a single line. 

So I had a lot of fun working through these examples.  The major differences were

  • Amount of Code and Code Readability
  • Immutability and ready for parallelism
    I am not planning to refactor the rest of the project, but you can too as the project is found here.  I am curious if using an array of arrays is the best way to represent the matric –> I guess it is standard for the curly-brace community?  I would think using Deedle would be better, but I don’t know enough about it (yet).


Two More Reasons To Use F#

On March 1st, James McCaffrey posted a blog article about why he doesn’t like FSharp found here.  Being that it took 3 weeks for anyone to notice is revealing in of itself, but the post is probably important  being that McCaffrey writes monthly in MSDN on machine learning/scientific computing so he has a certain amount of visibility.  To his credit, McCaffrey did try and use F# in one of his articles when FSharp first came out –> unfortunately, he wrote the code in an imperative style so he pretty much missed the point and benefit of using F#.  Interestingly, he also writes his C# without using the important OO concepts that would make his code much more usable to the larger community (especially polymorphic dispatch). 

In any event,  the responses from the FSharp community were what you would pretty much expect, with two very good responses here and here (and probably more to come).   I had posed this similar question to the FSharp Google group a while back with even more reasons why people don’t use FSharp and some good responses why they use it.  Recently, Eric Sink also wrote a good article on FSharp adoption found here.

For the last year, I have had the opportunity to work with a couple of startups in Raleigh, NC that are using FSharp and have a couple of observations that haven’t been mentioned so far (I think) in response to McCaffrey :

  • CTOs in FSharp shops don’t want you to learn FSharp.  They view using FSharp as a competitive advantage and hope that their .NET competitors continue to use C# exclusively.  Their rational is less to do with the language itself (C# is a great language), but the folks who can’t go between the two languages (or see how learning FSharp makes you a better C# coder and vice-versa) are not the developers they want on their team. The FSharp shops I know about  have no problem attracting top-flight talent –> no recruiter, no posts on dice, no resumes, no interviews.  Interestingly, the rock star .NET developers have already left their  C# comfort zone.  A majority of these developers are webevs so they have been using javascript for least a couple of years.  For many, it was their first foray out of the C# bubble and they hated it.  But like most worthwhile things, they stuck with it and now are proficient and may even enjoy it.  In any event, McCaffrey also doesn’t like HTML/Javascript/CSS (7:45 here) so I guess those developers are in the same boat.

  • You don’t want any of the the 100,000 jobs on Stack Overflow that McCaffrey talks about.  My instinct is that those jobs are targeted to the 50% of the C# developers still don’t use linq and/or lambda expressions.  Those are the companies that view developers as a commodity.  This is not where you want to be because:
  1. They are wrong.  The world is not flat.  Never has been.  CMMI, six-sigma process improvement, and other such things do not work in software engineering.  The problem for those companies is that they have lots of architects that don’t write production code, project managers that are second-careering into technology, and off-shore development managers who have no idea about the domain they are managing.  All of these people all have mortgages, colleges to pay for etc… so this self-protecting bureaucracy will be slow to die.  Therefore, they will continue to try and attract coders that don’t want to think outside their comfort zone
  2. It sucks working there – because you are just a cog in their machine.  You will probably be maintaining post-back websites or fat-client applications.  Who needs Xamerian anyway?  And be happy with that 2% raise.  But they do have a startup culture.

In any event, I hope to meet McCaffery at //Build later this month.  My guess is that since his mind is made up, nothing I say will change his opinion.  But, it should be interesting to talk with him and I really do enjoy his article’s on MSDN – so we have that common ground.

WCPSS Scores and Property Tax Valuations Using R

With all of the data gathered and organized I was ready to do some analytics using R.  The first thing I did was to load the four major datasets into R.

image

  • NCScores is the original dataset that has the school score.  I had already done did an analysis on it here.
  • SchoolValuation is the aggrgrate property values for each school as determined by scraping the Wake County Tax Website and Wake County School Assignment websites.  You can read how it was created here and here.
  • SchoolNameMatch is a crosswalk table between the school name as found in the NCScores dataframe and the School Valuation dataframe.  You can read how it was created here
  • WakeCountySchoolInfo is an export from WCPSS that was tossed around at open data day.

Step one was to reduce the North Carolina Scores data to only Wake County

1 #Create Wake County Scores From NC State Scores 2 WakeCountyScores <- NCScores[NCScores$District == 'Wake County Schools',] 3

The next step was to add in the SchoolNameMatch so that we have the Tax Valuation School Name

1 #Join SchoolNameMatch to Wake County Scores 2 WakeCountyScores <- merge(x=WakeCountyScores, y=SchoolNameMatch, by.x="School", by.y="WCPSS") 3

Interestingly, R is smart enough that the common field not duplicated, just the additional field(s) are added

image

The next step was to add in the Wake County Property Values, remove the Property field as it is no longer needed, and convert the TaxBase field from string to numeric

1 #Join Property Values 2 WakeCountyScores <- merge(x=WakeCountyScores, y=SchoolValuation, by.x="Property", by.y="SchooName") 3 4 #Remove Property column 5 WakeCountyScores$Property = NULL 6 7 #Turn tax base to numeric 8 WakeCountyScores$TaxBase <- as.numeric(WakeCountyScores$TaxBase) 9

Eager to do an analysis, I pumped the data into a correlation

1 #Do a Correlation 2 cor(WakeCountyScores$TaxBase,WakeCountyScores$SchoolScore,use="complete") 3

image

So clearly my expectations that property values track with FreeAndReducedLunch (.85 correlation) were not met.  I decided to use Practical Data Science with R Chapter 3 (Exploring Data)  as a guide to better understand the dataset.

1 #Practical Data Science With R, Chapter3 2 summary(WakeCountyScores) 3 summary(WakeCountyScores$TaxBase) 4

image

image

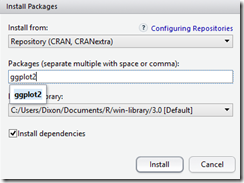
So there is quite a range in tax base!  The next task was to use some graphs to explore the data.  I added in ggplot2
image

and followed the books example for a histogram.  I started with score and it comes out as expected.  I then tried a historgram on TaxBase and had to tinker with the binwidth to make a meaningful chart:

1 #Historgrams 2 ggplot(WakeCountyScores) + geom_histogram(aes(x=SchoolScore),binwidth=5,fill="gray") 3 ggplot(WakeCountyScores) + geom_histogram(aes(x=TaxBase),binwidth=10000,fill="gray") 4 #Ooops 5 ggplot(WakeCountyScores) + geom_histogram(aes(x=TaxBase),binwidth=5000000,fill="gray") 6


image

image

The book then moves to an example studying income, which is directly analogous to the TaxBase so I followed it very closely.  The next graph were some density graphs.  Note the second one is a logarithmic one:

1 #Density 2 library(scales) 3 ggplot(WakeCountyScores) + geom_density(aes(x=TaxBase)) + scale_x_continuous(labels=dollar) 4 ggplot(WakeCountyScores) + geom_density(aes(x=TaxBase)) + scale_x_log10(labels=dollar) + annotation_logticks(sides="bt") 5


image


image

So kinda interesting that most schools cluster in terms of their tax base, but because there is such a wide range with a majority clustered to the low end, the logarithmic curve is much more revealing.

The book then moved into showing the relationship between two variables.  In this case, SchoolScore as the Y variable and TaxBase as the X variable:

1 #Relationship between TaxBase and Scores 2 ggplot(WakeCountyScores, aes(x=TaxBase, y=SchoolScore)) + geom_point() 3 ggplot(WakeCountyScores, aes(x=TaxBase, y=SchoolScore)) + geom_point() + stat_smooth(method="lm") 4 ggplot(WakeCountyScores, aes(x=TaxBase, y=SchoolScore)) + geom_point() + geom_smooth() 5

image

image

image

So what is interesting is that there does not seem to be a strong relationship between scores and tax base.  There looks like an equal number of schools both below the score curve than above it.  Note that using a smoothing curve is much better than the linear fit curve in showing the relationship of scores to tax base.  You can see the dip in the lower quartile and the increase at the tail.  It makes sense that the higher tax base shows an increase in scores, but what’s up with that dip?

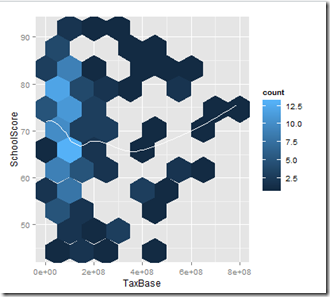
Finally, the same data is shown using a hax chart

1 library(hexbin) 2 ggplot(WakeCountyScores, aes(x=TaxBase, y=SchoolScore)) + geom_hex(binwidth=c(100000000,5)) + geom_smooth(color="white",se=F) 3
image

So taking a step back, it is clear that there is a weakness in this analysis.  Some schools have thousands of students, some schools have a couple hundred.  (high schools versus elementary students). Using the absolute dollars from the tax valuation is misleading.  What we really need is revenue per student.  Going back to the SchoolInfo dataframe, I added it in and pulled a student count column.

1 WakeCountyScores <- merge(x=WakeCountyScores, y=WakeCountySchoolInfo, by.x="School", by.y="School.Name") 2 names(WakeCountyScores)[names(WakeCountyScores)=="School.Membership.2013.14..ADM..Mo2."] <- "StudentCount" 3 WakeCountyScores$StudentCount <- as.numeric(WakeCountyScores$StudentCount) 4 5 WakeCountyScores["TaxBasePerStudent"] <- WakeCountyScores$TaxBase/WakeCountyScores$StudentCount 6 summary(WakeCountyScores$TaxBasePerStudent) 7

Interestingly, the number of records in the base frame dropped from 166 to 152, which means that perhaps we need a second mapping table.  In any event, you can see that the average tax base is $6.5 million with a max of $114 Million.  Quite a range!

image

Going back to the point and hex graphs

1 ggplot(WakeCountyScores, aes(x=TaxBasePerStudent, y=SchoolScore)) + geom_point() + geom_smooth() 2 ggplot(WakeCountyScores, aes(x=TaxBasePerStudent, y=SchoolScore)) + geom_hex(binwidth=c(25000000,5)) + geom_smooth(color="white",se=F) 3


image

image

There is some interesting going on.  First, the initial conclusion that a higher tax base leads to a gradual increase in scores is wrong once you move from total tax to tax per student.

Also, note the significant drop in school scores once you move away from the lowest tax base schools, the recovery, and then the drop again.  From a real estate perspective, these charts suggest that the marginal value of a really expensive or really inexpensive house in Wake County is not worth it (at least in terms of where you send you kids), and there is a sweet spot of value above a certain price point. 

You can find the gist here and the repo is here.

Some lessons I learned in doing this exercise:

  • Some records got dropped between the scores dataframe and the info dataframe -> so there needs to be another mapping table
  • Make the tax base in millions
  • What’s up with that school with 114 million per student?
  • An interesting question is location of dollars to school compared to tax base.  I wonder if that is on WCPSS somewhere.  Hummm…
  • You can’t use the tick(‘) notation, which means you do a lot of overwriting of dataframes.  This can be a costly and expensive feature of the language.  It is much better to assume immutably, even if you clutter up your data window.

As a final note, I was using the Console window b/c that is what the intro books do.  This is a huge mistake in R Studio.  It is much better to create a script and send the results to the console

image

So that you can make changes and run things again.  It is a cheap way of avoid head-scratching bugs…