Wake County Voter Analysis Using FSharp, AzureML, and R

One of the real strengths of FSharp its ability to plow through and transform data in a very intuitive way,  I was recently looking at Wake Country Voter Data found here to do some basic voter analysis.  My first thought was to download the data into R Studio.  Easy?  Not really.  The data is available as a ginormous Excel spreadsheet of database of about 154 MB in size.  I wanted to slim the dataset down and make it a .csv for easy import into R but using Excel to export the data as a .csv kept screwing up the formatting and importing it directly into R Studio from Excel resulting in out of memory crashes.  Also, the results of the different election dates were not consistent –> sometimes null, sometimes not.   I managed to get the data into R Studio without a crash and wrote a function of either voted “1” or not “0” for each election

1 #V = voted in-person on Election Day 2 #A = voted absentee by mail or early voting (through May 2006) 3 #M = voted absentee by mail (November 2006 - present) 4 5 #O = voted One-Stop early voting (November 2006 - present) 6 #T = voted at a transfer precinct on Election Day 7 #P = voted a provisional ballot 8 #L = Legacy data (prior to 2006) 9 #D = Did not show 10 11 votedIndicated <- function(votedCode) { 12 switch(votedCode, 13 "V" = 1, 14 "A" = 1, 15 "M" = 1, 16 "O" = 1, 17 "T" = 1, 18 "P" = 1, 19 "L" = 1, 20 "D" = 0) 21 } 22

However, every time I tried to run it, the IDE would crash with an out of memory issue. 

 Stepping back, I decided to transform the data in Visual Studio using FSharp. I created a sample from the ginormous excel spreadsheet and then imported the data using a type provider.  No memory crashes!

1 #r "../packages/ExcelProvider.0.1.2/lib/net40/ExcelProvider.dll" 2 open FSharp.ExcelProvider 3 4 [<Literal>] 5 let samplePath = "../../Data/vrdb-Sample.xlsx" 6 7 open System.IO 8 let baseDirectory = __SOURCE_DIRECTORY__ 9 let baseDirectory' = Directory.GetParent(baseDirectory) 10 let baseDirectory'' = Directory.GetParent(baseDirectory'.FullName) 11 let inputFilePath = @"Data\vrdb.xlsx" 12 let fullInputPath = Path.Combine(baseDirectory''.FullName, inputFilePath) 13 14 type WakeCountyVoterContext = ExcelFile<samplePath> 15 let context = new WakeCountyVoterContext(fullInputPath) 16 let row = context.Data |> Seq.head

I then applied a similar function for voted or not and then exported the data as a .csv

1 let voted (voteCode:obj) = 2 match voteCode = null with 3 | true -> "0" 4 | false -> "1" 5 6 open System 7 let header = "Id,Race,Party,Gender,Age,20080506,20080624,20081104,20091006,20091103,20100504,20100622,20101102,20111011,20111108,20120508,20120717,20121106,20130312,20131008,20131105,20140506,20140715,20141104" 8 9 let createOutputRow (row:WakeCountyVoterContext.Row) = 10 String.Format("{0},{1},{2},{3},{4},{5},{6},{7},{8},{9},{10},{11},{12},{13},{14},{15},{16},{17},{18},{19},{20},{21},{22},{23}", 11 row.voter_reg_num, 12 row.race_lbl, 13 row.party_lbl, 14 row.gender_lbl, 15 row.eoy_age, 16 voted(row.``05/06/2008``), 17 voted(row.``06/24/2008``), 18 voted(row.``11/04/2008``), 19 voted(row.``10/06/2009``), 20 voted(row.``11/03/2009``), 21 voted(row.``05/04/2010``), 22 voted(row.``06/22/2010``), 23 voted(row.``11/02/2010``), 24 voted(row.``10/11/2011``), 25 voted(row.``11/08/2011``), 26 voted(row.``05/08/2012``), 27 voted(row.``07/17/2012``), 28 voted(row.``11/06/2012``), 29 voted(row.``03/12/2013``), 30 voted(row.``10/08/2013``), 31 voted(row.``11/05/2013``), 32 voted(row.``05/06/2014``), 33 voted(row.``07/15/2014``), 34 voted(row.``11/04/2014``) 35 ) 36 37 let outputFilePath = @"Data\vrdb.csv" 38 39 let data = context.Data |> Seq.map(fun row -> createOutputRow(row)) 40 let fullOutputPath = Path.Combine(baseDirectory''.FullName, outputFilePath) 41 42 let file = new StreamWriter(fullOutputPath,true) 43 44 file.WriteLine(header) 45 context.Data |> Seq.map(fun row -> createOutputRow(row)) 46 |> Seq.iter(fun r -> file.WriteLine(r)) 47

The really great thing is that I could write and then dispose of each line so I could do it without any crashes.  Once the data was into a a .csv (10% the size of Excel), I could then import it into R Studio without a problem.  It is a common lesson but really shows that using the right tool for the job saves tons of headaches.

I knew from a previous analysis of voter data that the #1 determinate of a person from wake county voting in a off-cycle election was their age:

image

image

image

So then in R, I created a decision tree for just age to see what the split was:

1 library(rpart) 2 temp <- rpart(all.voters$X20131008 ~ all.voters$Age) 3 plot(temp) 4 text(temp)

Thanks to Placidia for answering my question on stats.stackoverflow

image

So basically politicians should be targeting people 50 years or older or perhaps emphasizing issues that appeal to the over 50 crowd.


Kaggle and R

Following up on last week’s post on doing a Kaggle competition, I then decided to see if I could explore the data more in R on my local desktop.  The competition is about analyzing a large group of house claims to give them a risk score.

I started the R studio to take a look at the initial data:

1 train <- read.csv("../Data/train.csv") 2 head(train) 3 summary(train) 4 5 plot(train$Hazard)

image

A couple of things popped out.  All of the X variables look to be categorical.  Even the result “Hazard” is an integer with most of the values falling between 1 and 9.

With that in mind, I decided to split the dataset into two sections: the majority and the minority.

1 train.low <- subset(train, Hazard < 9) 2 train.high <- subset(train, Hazard >= 9) 3 4 plot(train.low$Hazard) 5 plot(train.high$Hazard)

With the under as:

image

And the over 9 is like this

image

But I want to look at the Hazard score from a distribution point of view:

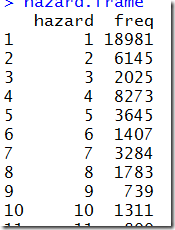
1 hazard.frame <- as.data.frame(table(train$Hazard)) 2 colnames(hazard.frame) <- c("hazard","freq") 3 hist(hazard.frame$freq) 4 plot(x=hazard.frame$hazard, y=hazard.frame$freq) 5 plot(x=hazard.frame$hazard, log(y=hazard.frame$freq)) 6

The hist shows the left skew

image


image

and the log plot really shows the distribution

image

So there is clearly a diminishing return going on.   As of this writing, the leader is at 40%, which is about 20,400 of the 51,000 entries.   So if you could identify all of the ones correctly, you should get 37% of the way there.  To test it out, I submitted to Kaggle only ones:

image

LOL, so they must take away for incorrect answers as it is same as “all 0” benchmark.  So going back, I know that if I can predict the ones correctly and make a reasonable guess at the rest, I might be OK.   I went back and tuned my model some to get me out of the bottom 25% and then let it be.  I assume that there is something obvious/industry standard that I am missing because there are so many people between my position and the top 25%.

Kaggle and AzureML

If you are not familiar with Kaggle, it is probably the de-facto standard for data science competitions.  The competitions can be hosted by a private company with cash prizes or it can be a general competition with bragging rights on the line.  The Titanic Kaggle competition is one of the more popular “hello world” data science projects that is a must-try for aspiring data scientists.

Recently, Kaggle hosted a competition sponsored by Liberty Mutual to help predict the insurance risk of houses.  I decided to see how well AzureML could stack up against the best data scientists that Kaggle could offer.

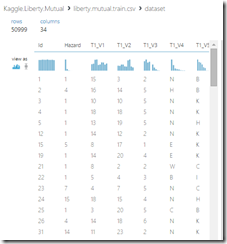
My first step was to get the mechanics down (I am a big believer in getting dev ops done first).  I imported the train and test datasets from Kaggle into AzureML.  I visualized the data and was struck that all of the vectors were categorical, even the Y variable (“Hazard”) –> it is an int with a range between 1 and 70.

image

I created a quick categorical model and ran it.  Note I did a 60/40 train/test split of the data

image

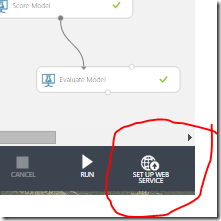
Once I had a trained model, I hit the “Set Up Web Service” button.

image

I then went into that “web service” and changed the input from a web service input to the test dataset that Kaggle provided.  I then outputted the data to azure blob storage.  I also added a transform to only export the data that Kaggle wants to evaluate the results: ID and Hazard:

image

Once the data was in blob storage, I could download it to my desktop and then upload it to Kaggle to get an evaluation and a ranking.

image

With the mechanics out of the way, I decided to try a series of out of box models to see what gives the best result.  Since the result was categorical, I stuck to the classification models and this is what I found:

image

image

The OOB Two Class Bayes Point Machine is good for 1,278 place, out of about 1,200 competitors.

Stepping back, the hazard is definitely left-skewed so perhaps I need two models.  If I can predict if the hazard is between low and high group, I should be able to be right with most of the predictions and then let the fewer outlier predictions use a different model.  To test that hypotheses, I went back to AzureML and added a filter module for Hazard < 9

image

The problem is that the AUC dropped 3%.  So it looks like the outliers are not really skewing the analysis.  The next thought is that perhaps AzureML can help me identify the x variables that have the greatest predictive power.  I dragged in a Filter Based Feature Selection module and ran that with the model

image image

The results are kinda interesting.  There is a significant drop-off after these top 9 columns

image

So I recreated the model with only these top 9 X variables

image

And the AUC moved to .60, so I am not doing better.

I then thought of treating the Hazard score not as a factor but as a continuous variable.   I rejiggered the experiment to use a boosted decision tree regression

image

So then sending that over to Kaggle, I moved up.  I then rounded the decimal but that did this:

image

So Kaggle rounds to an int anyway.  Interestingly, I am at 32% and the leader is at 39%. 

I then used all of the OOB models for regression in AzureML and got the following results:

image

Submitting the Poisson Regression, I got this:

image

I then realized that I could mike my model <slightly> more accurate by not including the 60/40 split when doing the predictive effort.  Rather, I would put all 100% of the training data to the model:

image

Which moved me up another 10 spots…

image

So that is a good way to stop with the out of the box modeling in AzureML. 

There are a couple of notes here

1) Kaggle knows how to run a competition.  I love how easy it is to set up a team, submit an entry, and get immediate feedback.

2) AzureML OOB is a good place to start and explore different ideas.  However, it is obvious that stacked against more traditional teams, it does not do well

3) Speaking of which.  You are allowed to submit 5 entries a day and the competition lasts 90 days or so.  With 450 entries, I am imagine a scenario where a person can spend their time gaming their submissions.  There are 51,000 entries so and the leading entry (as of this writing) is around 39% so there are 20,000 correct answers.  That is about 200 correct answers a day or 40 each submission.

F#, REPL Driven Development, and Scrum

Last week,  I did a book review of sorts on Scrum: The Art of Doing Twice The Work In Half The Time.  When I was reading the text, an interesting thought hit me several times.  As a pragmatic practitioner of Test Driven Development (TDD), which often goes hand in hand with Agile and Scrum ideas, I often wonder if I am doing something the best way.  I remember distinctly Robert C Martin talking about being your new CTO with the goal of all of the code working correctly all of the time and that he didn’t care if you used TDD, but he doesn’t know a better way.

image

I was thinking how lately I have been practicing REPL-driven development using F#.  If you are not familiar, REPL stands for “READ-EVALUATE-PRINT-LOOP” and has been the primary methodology of functional programmers and data scientists for years.  In RDD, I quickly prove out my idea tin the REPL to see if I make sense.  it is strictly happy path programming.  Once I think I have a good idea or a solution to whatever problem I am working on, I lift the code into a compiled assembly.  The data elements I used in the REPL then get ported over into my unit tests.  I typically use C# unit tests so that I can confirm that my FSharp code will interop nicely with any VB.NET/C# projects in the solution.  I then layer on code coverage to make sure I have covered all happy paths and then throw some fail cases at the code.

Thinking of this methodology, I think it is closer to Scrum than traditional TDD for a couple of reasons:

Fail Fast and Fix early.  You cannot prove out ideas any faster than in the REPL except for maybe a dry board.  Curly-braces and OO-centered languages like Java and C# are great for certain jobs, but the require much more ceremony and code for code’s sake.  As Sutherland points out, context-switching is a killer.  The less you have to worry about code (classes, moqs, etc..) the faster and better you will be at solving your problem.

Working Too Hard Makes More Work. One of the most startling things about using F# on real projects is that there is just not very much code.  I finished and looked around to see what I missed.  My unit tests were passing, code coverage was high, and there just wasn’t much code.  It was quite unsettling.  I now realize that lots of C#/Java code needs to be generated for real programming projects (exception handling, class hierarchies, design patterns, etc…).  But as the Dartmouth Basic Manual once said “typing is not a substitute for thinking”, all of this code begets more code.  It is a cycle of work that creates more work that F# does not have.

Duplication/Boilerplates/Templates. Complete and Total Waste So this one is pretty self-explanatory.  Many people  (myself included) think that Visual Studio needs better F# templates.  However, once you get good at writing F# code, you really don’t need them.  Maybe it is good that there aren’t many more?  In any event, you don’t use templates and boiler plates in the REPL…